⏮️ Previous chapter: System Design Vocabulary
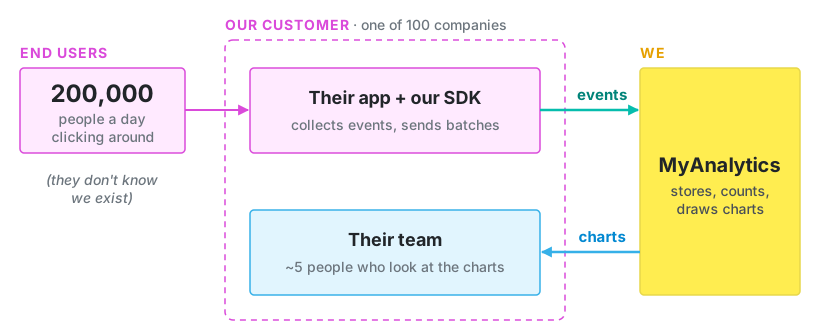
Here’s our app: MyAnalytics, an analytics tool. We are event driven, which means that customers (=other companies) send us events of their apps: page views, user clicks, … . We build dashboards out of these events.
What I like about this scenario is:
- we don’t control the flow of inbound traffic, users send us as much data as they want and on their own schedule, and we will experience unexpected traffic spikes
- the database will grow and grow and grow and …
- the reads will be huge and also small, every dashboard will show whatever the user wants it to show, this could be millions of events or just 3 events
In this post
MyAnalytics from the customer’s perspective
For our customers:
- They add our SDK (a small JS/Go/Python/… library) to their app. The SDK collects events and sends them to us in small batches.
- They log into MyAnalytics and look at dashboards: charts of events over time, broken down by country, browser, plan…
- They build funnels: of everybody who saw the pricing page, how many signed up, and how many of those actually paid?
One event is a small JSON object:
{
  "event": "signed_up",
  "uuid": "0192f6c4-7b1a-7c3e-9d2a-5f3e8b1c4d6e",
  "user_id": "user_8412",
  "timestamp": "2026-09-25T09:14:03.512Z",
  "properties": { "browser": "Firefox", ...}
}
MyAnalytics’s own priorities
Now, what are the priorities of our system?
- Never slow down our customers’ apps. The SDK sends in the background, and our side answers in milliseconds, whatever is happening behind it.
- Don’t lose events. Mostly. I think we can’t avoid ever losing an event, but losing an hour of a customer’s data is generally unacceptable. (Unless we bow down afterward repeatedly and accept to have a tarnished reputation.)
- Don’t count anything twice. The numbers have to match. If our dashboard says their funnel got 6 people to buy their services, but they know it was just 4, our MyAnalytics will look untrustworthy.
- Dashboards can be a few minutes behind.
- A chart should load in a few seconds, not a few minutes.
- Customers never, ever see each other’s data.
There already is a dichotomy here: The writing has to be fast and still precise. The reading is allowed to be a bit late and a bit slow.
How many customers will we have?
No idea :)
But, we can’t start this exercise without some numbers… so, let’s say our first goal is 100 customers. And let’s say their apps have together 200,000 active users a day (about 2k users each). And let’s say one user produces 50 events a day.
This gives us:
\[200,000\text{ users} * 50\text{ events} = 10\text{M events/day}\] \[\frac{10,000,000\text{ events/day}}{86,400 \text{ s/day}} ≈ 115 \text{ events/s}\]Let’s say our peak is 3x the average, so \(350 \text{ events/s}\), but the SDK batches events into groups of 10, so then this is only \(35 \text{ requests/s}\). Not that much really, but that’s to be expected at 100 customers.
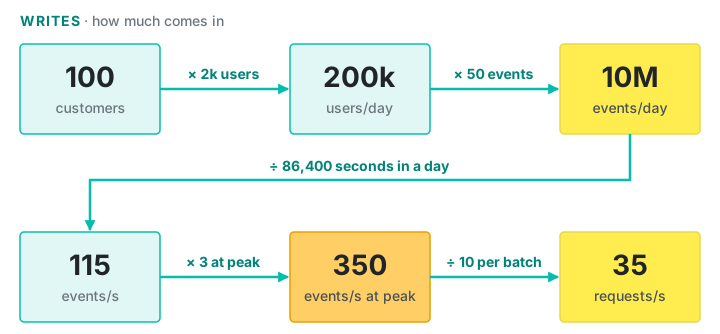
Ok, \(35 \text{ requests/s}\) at peak times is not that much.
Ok, what about the DB size? In reality, we only need to think about 1 table: the one that will hold the events data. This table will get the most writes and will grow and grow.
Rabbit hole: how to calculate row size
For estimations, it is ok to pretend that JSON ≈ DB: if the JSON data is about 200B, we can pretend that this will be about 200B of data in Postgres too.
Things that complicate this assumption are:
- indexes: the more indexes you have, the more extra data it will be
- column types: JSON is mostly sending strings, whereas a DB has dedicated column types that are optimized
- DB overhead: every DB row has some overhead that we are ignoring here
- specialized databases: they might have very specific rules about how they store data (example: Clickhouse)
- and probably other things that I can’t think of right now
In our MyAnalytics example, the biggest space hoggers are the event properties. The users can send whatever they want: plan, url, browser, button, experiment_num, device, … So, we will restrict their number, how many they can send per event. (Not their cardinality = how many different ones they can send.)
Here’s a silly calculation:
  properties (jsonb, ~15–20 keys)          ~500 B
  customer_id, uuid, ts, user_id, name      ~50 B
  Postgres row overhead                     ~30 B   (24B header + 4B pointer)
  unique index (customer_id, uuid)          ~50 B   (~36B entry, pages ~70% full)
  ------------------------------------------------
                                           ≈ 630 B  → round up to ~1 KB
But then we round this up to 1 KB. Better to round up than down here, we are anyway looking more at the order of magnitude (1 KB vs 10 KB), not the precise number.
I was told… 😉 that you can run this SQL:
SELECT pg_total_relation_size('my_events') / (SELECT count(*) FROM my_events)
if you want to know the exact average row size for a table you actually have. But I haven’t tried it out.
Our estimate is that we will store about \(1 KB\) per event. We expect \(10\text{M events/day}\), so about:
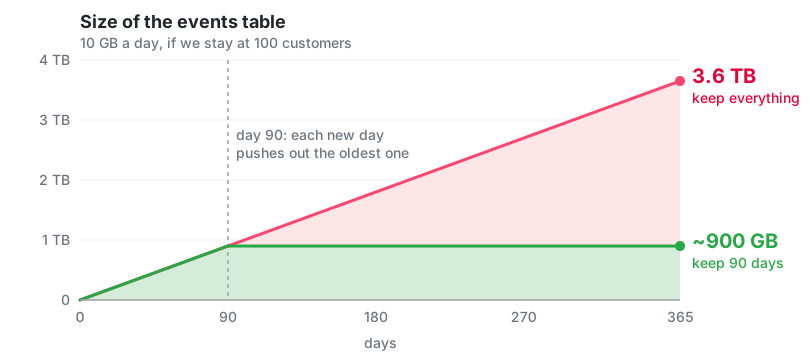
\[10,000,000\text{ KB/day}=10\text{ GB/day}\]In a month (30 days), we get to \(300\text{ GB}\) and in a year (365 days) we are at \(3650\text{ GB} = 3.6 \text{ TB}\). That is, of course, if we can stay at exactly 100 customers for a whole year.
So, the individual requests aren’t big, but the data that accumulates forever grows very quickly.
We’ll have to talk about retention: for how long are we keeping their data?
What about the reads?
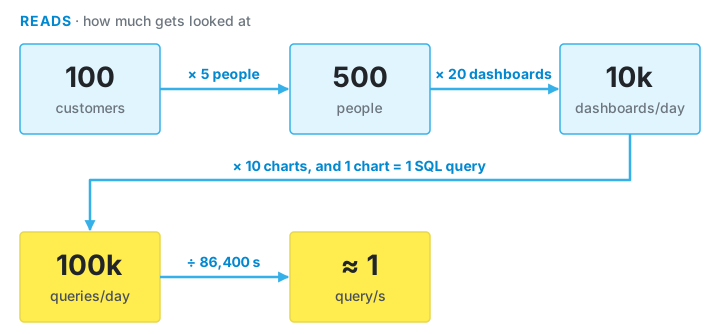
How many MyAnalytics users will our customers have? Let’s say 5.
How many dashboards will these people look at on average per day? Let’s say 20. And let’s say every dashboard will have 10 charts.
\[100 \text{ customers} * 5 \text{ users} * 20 * 10 \text{ charts} = 100,000 \text{ charts/day}\]Let’s now also say that 1 chart == 1 SQL query. So, then we are making a bit more than \(100,000 \text{ SQL queries / day}\).
What do you get when you base rough estimates on top of other rough estimates that were also based on top of rough estimates?…. A very precise load of guesses. So, I have to remind myself: “we are looking for order of magnitude only”, “we are looking for order of magnitude only”.
How big is one query?
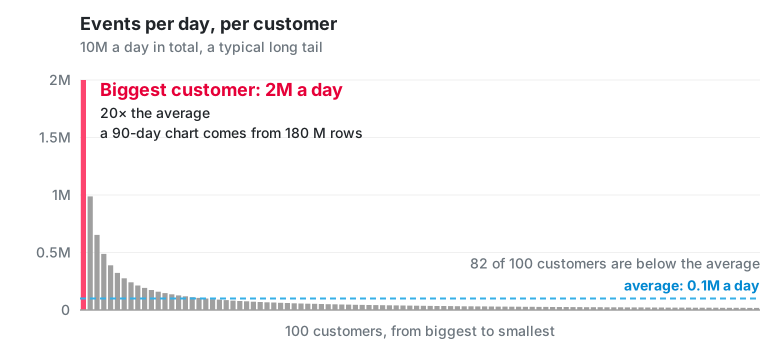
We’ll have small and big customers.
Let’s say our biggest one has 20x the average traffic. Avg traffic is \(0.1 \text{ M events/day}\), so our biggest one is \(2 \text{ M events/day}\). A 90-day chart over their raw events has to go through 180 million rows. Postgres can do that, but it won’t be quick.
The boxes
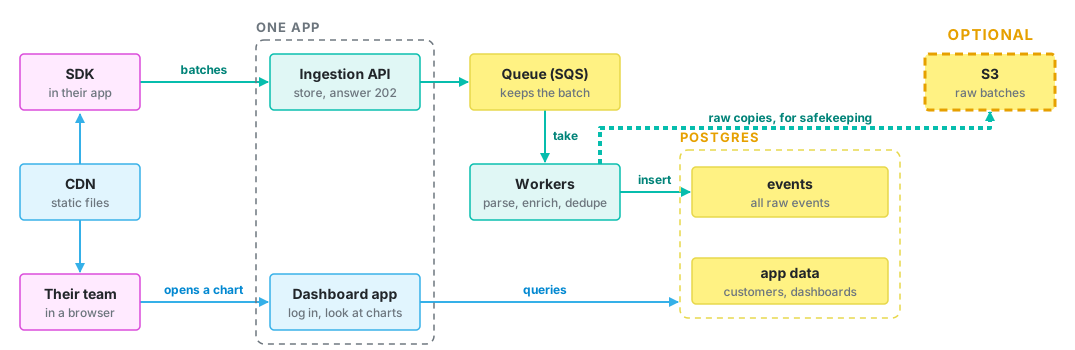
Let’s follow one event, from a click in our customer’s app to a bar in their chart.
1. The SDK runs inside our customer’s app. It collects events in memory and sends them as a batch every few seconds (or when the page is being closed). Every event gets its UUID right here, in the SDK. (A UUIDv7, which starts with a timestamp, so they sort nicely by time.)
2. The ingestion API does exactly 1 thing: take the batch, make sure it’s stored, answer. It checks the API key, the customer’s rate limit, that the batch isn’t absurdly big, and sends the whole batch, as it is, to a queue. Once the queue confirms it has the batch, it answers 202 Accepted (202 instead of 200, because 202 means “we accepted, but will process later”).
Because we don’t parse at all, we are very fast (a few milliseconds).
Since we process the events later, the dashboards are a bit behind, but the event is safely stored in the meantime. If we stored the events only after we processed them, then a bug in our code or a weird event could cause us to drop the event. Better late than never.
3. The workers take batches from the queue. They parse the events, drop duplicates, validate/sanitize the data, insert the events into the events table, and only then delete the batch from the queue. If a worker crashes halfway, the batch simply comes back and another worker takes it.
The queue is an actual queue like RabbitMQ, SQS or Google Pub/Sub. If this was just a hobby project, then we could use Postgres instead of a queue (side quest: if you’ll use PG, look into SELECT ... FOR UPDATE SKIP LOCKED), but a separate queue has 2 advantages:
- the ingestion doesn’t need the main database: even if PG goes down, we are still accepting events
- we won’t have to migrate later: once we have many more than 100 customers.
A word about the sanitization of event data: if we can’t process some part of the event data, then we will simply cut that data out. We can’t ask for permission here, because this step is happening in the queue workers, not the ingestion API. But, what we can do, is have a “Warnings” page, where we list all the hard decisions we were forced to make with their data.
4. Postgres stores processed events and all other data:
events            id, customer_id, uuid, user_id, name, ts, properties
                  unique (customer_id, uuid)
+ the app itself: customers, API keys, accounts, dashboards
We keep raw events for 90 days. Every night, a job deletes rows that are too old.
Rabbit hole: Postgres partitions
It turns out that nightly deletions of 10M rows can be expensive when a table has lots of rows.
For this reason, we could have split our events table in partitions, one partition per day. Every night we would then delete precisely 1 partition, the oldest one.
Every partition is a small table of its own, but we still query events as one table, and Postgres picks the right partitions by itself.
The catch is… lots of ORMs don’t support partitions. Thus, you’d be fighting your own system when interacting with partitions. So, you have to decide if it’s worth it for you.
The one time, I had to deal with a table that was simply too big for PG, I moved the data out of PG and into Redis. Deletes in Redis are essentially for free, so retention is kinda solved. A better, more deliberate data model structure was a better solution for us than partitions.
You have to decide for yourself.
5. The dashboard app is the same app as the ingestion API. A lot of heavy work happens in the workers, which are already a separate service.
The thing to look out for is a slow dashboard query blocking the ingestion API, because they do share resources, since they are in the same app. But for now we are building towards only 35 requests/s, so we accept this risk.
Once this becomes a problem, a good solution is to split these into 2 separate services (=machines, pods).
6. A CDN serves the SDK’s JS file. Every page view of every customer’s site loads it, so it’s by far our most downloaded file, and it has to load fast everywhere in the world. The dashboard’s JS and CSS go through it too just because once we have a CDN, why not just use it for everything.
7. S3 optional (or any S3-like storage: R2, GCS). If we feel paranoid about the events we are being sent, then we can store them before processing them. The idea is to be able to go back and replay them, in case we had a bug in our code, or we just felt like re-processing them. Realistically, it’s not clear that we will ever want to replay all messages, but at least we are keeping our options open.
About the storage size: data will only ever accumulate, at the rate of about 5 GB/day of raw JSON. But, if we write batches of msgs only every few minutes and compress the JSON, the storage can be incredibly small.
Metrics
The plan is to scale up, once the system isn’t enough anymore. But to do that, we need to track some numbers.
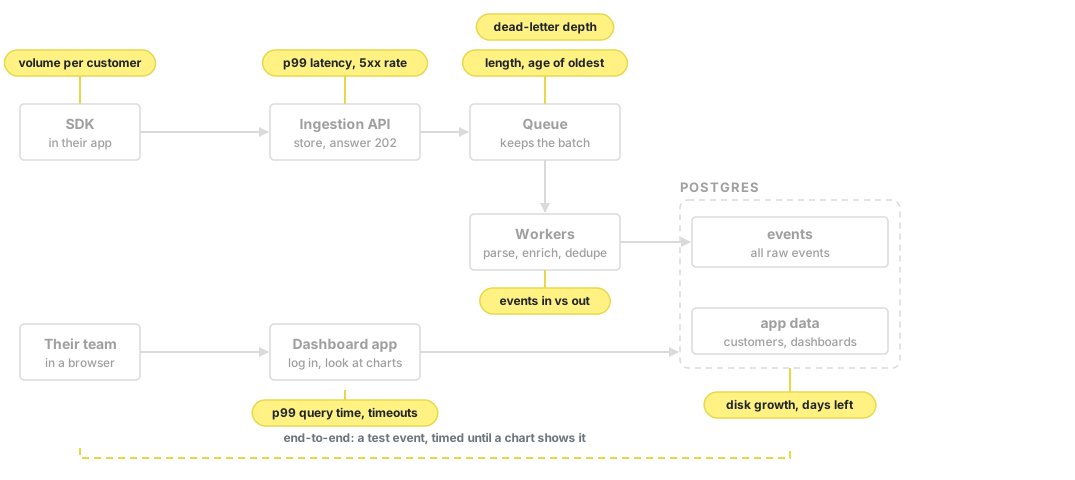
- Lag: the age of the oldest unprocessed event. This is the number of an event system, it’s how far behind the dashboards are. For auto-scaling the number of workers we need watch the length of the queue. However, we should alert on age of the messages, because it tells us how long the customers are waiting.
- In vs out: events received per second vs events processed per second. If the workers process less than comes in, the lag will only grow. This is almost the same as queue length, while technically being its derivative: in minus out is how fast the queue is growing, the length is how much already piled up.
- Disk: growth per day, and how many days until it’s full.
- Dashboard queries: p99 query time, and how many hit the timeout. And as your app grows, even p99.9 and p99.99 are worth inspecting, but only once we get enough requests: with \(100,000\) queries a day, p99 is \(1,000\) queries, p99.9 is \(100\) and p99.99 is \(10\), which might not be worth it, or it might show some interesting examples.
Fancy metrics:
- Volume per customer to detect one customer’s requests suddenly changing drastically, which might be due to their bug or your bug.
- An end-to-end check. Now this is very experimental, but useful. Every so often (every minute?), send a real test event through the real SDK and measure how long until a query sees it. This is the only true test of what the customers see. I never did this explicitly, but we did use our own service, which meant we did this implicitly, so not on a schedule, but as it happened. It’s a neat trick to quickly detect when something went terribly wrong with your system.
More metric ideas:
- Ingestion error rate, so your 5xx separately from 4xx, because 5xx means your ingestion API is likely broken. But, we can get to the same values if we just monitor Sentry errors.
- Ingestion latency because our priority is to respond in milliseconds
- Dead-letter queue depth because you want this to be empty. A task ends up here, if something unpredicted happened, a thing that you can fix.
Plus: add anything your heart desires!
Single points of failure
Almost everything above exists exactly once. And everything is crucial.
- The app is down: the ingestion API is broken, we can’t record any events. The SDK can save us for a few minutes, they can retry, but just a few minutes.
- Postgres gets slow because the dashboard queries are too expensive. The ingestion API keeps working, it just writes into a queue. Workers get slow too, but when an insert fails, they just retry. (This opens up the question: how many times should they retry?) The queue will grow, which means the dashboards will show older data and workers will need to work more. A secondary solution is to invest time into optimizing the SQL queries, making them less expensive.
- The workers are down: nothing is lost, the ingestion API still records the events, but the dashboards show older data.
- The queue grows beyond what we can handle: for starters auto-scaling should create new workers, but we should also think about rate limiting our customers and possibly about load-shedding.
Other bad things can also happen, but I decided to list only the ones I believe are the most probable.
Rabbit holes
Rabbit hole: The SDK sends the same batch twice?
This will happen. Systems are either at-least-once or at-most-once, they are never really exactly-once.
So, we need to de-duplicate the input. We will probably de-dup in several layers.
We can de-dup before we write to the queue by storing individual JSONs or just their UUIDs in Redis for 10 mins or so. But then the ingestion API has to split the batch into single events, which it otherwise doesn’t do. If we have seen that UUID already, we drop the JSON, but still return 202 Accepted.
We should de-dup also before writing to events table. But this is simple, just add a unique key on (customer_id, uuid).
We also should expect race conditions here. It is still possible to have 2 identical JSON events in the queue and 2 workers picking one up at the same time. In this case, we should use some form of ON CONFLICT DO NOTHING and stop parsing this event and count this as success, not failure: the event was successfully processed, even though it resulted in no new event.
Rabbit hole: We shipped a silly bug and the workers crash for every JSON
Most probably nothing is really lost. Worst case scenario is the JSONs were picked up by a worker, the processing was retried a couple of times, then the JSON was moved over to the dead-letter-queue.
It will require a manual action from us to get those JSONs back, but we didn’t drop them on the floor.
The queue might get longer or very short. If the workers fail quickly, then the bug will look as if the workers are very fast now. It is only once we get the JSONs back from the dead-letter-queue that we will see how many un-processed events we have. So, it’s probably going to be Sentry that will alert us about this incident.
Now, let’s say we were at peak inbound requests, so at 350 events/s, and we were down for 1h.
How long will it take us to clear the queue?
If our workers are able to process 700 events/s, then it will take us only 1h to get through them (350 ordinary events + 350 old events). If our workers can only process 400 events/s, then they can only process 50 extra events every second, so it will take us 7h (350/50) to get through all.
What we can do:
- up the number of workers temporarily, but we are still limited by various other shared resources like Postgres
- move the JSONs from the dead-letter-queue at night, or when we generally don’t have much work
Rabbit hole: Our biggest customer opens a 90-day chart
We estimated that this is about \(180 \text{ M}\) rows, which might take a few minutes. This will slow down the workers that are writing new events, because the database has one CPU and one disk, and this massive SELECT is holding them hostage. We are looking at the noisy neighbor scenario.
What we can do:
- a
statement_timeoutfor dashboard queries, let’s say 30s, this won’t help much, but it will at least provide a ceiling as opposed to no ceiling, - moving dashboard queries to a read replica, because then the replica is tied up, not the workers, but this still doesn’t protect tenants from each other
- optimize the queries
- limit the max time window any chart can show
- create a cache for expensive queries, probably a materialized cache that we can query like a DB table, not a NoSQL cache like Redis
But, let’s not focus on these until we have more customers and this pattern actually becomes a problem.
Rabbit hole: One customer suddenly sends 50x their normal traffic?
It might be a bug on their side (a loop triggered the same event) or it might not be.
But, what is true is that the queue will temporarily spike.
Consequently, every customer’s events will be processed later, the dashboards will be a bit behind for everybody.
What we can do:
- add rate limit per API key at the ingestion API, limit the number of requests per second, but also requests per day
- add an alert on volume per customer
- create several queues: one per tenant or one per tier to limit the impact somewhat
Rabbit hole: Can we ever change the DB or the JSON schema?
Of course!
The database schema: The migration runs first, before new code is deployed, which means the old code is running on the new database for a few minutes.
This demands at least 2 steps for various changes like: dropping a column or renaming a column. The pattern is called expand and contract.
For indexes, look into CREATE INDEX CONCURRENTLY to prevent locks of a whole table, when the table in question has several millions of rows.
The event JSON schema: follows a very similar idea, but it’s much harder to achieve, because our customers are involved and who knows when they will upgrade their code. The only real solution is thus: the schema only ever grows and all new fields are always optional.
Next chapter
⏭️ To be continued...
External sources
- Designing Data-Intensive Applications (Martin Kleppmann)
- The Twelve-Factor App: Processes
- Google SRE Book: Monitoring Distributed Systems (the four golden signals)
- PostgreSQL docs: Table Partitioning
- pg_partman: automatic partition management for PostgreSQL
- PostgreSQL docs: SELECT ... FOR UPDATE SKIP LOCKED
- Wiki: Dead-letter queues
- Wiki: Multitenancy (where the noisy neighbor comes from)
- RFC 9562: UUIDs (including UUIDv7)
- MDN: 202 Accepted
- PostgreSQL docs: Database Page Layout (where the row overhead comes from)
- PostgreSQL docs: Database Object Size Functions
- Amazon SQS: Visibility timeout
- Brandur Leach: Implementing Stripe-like Idempotency Keys in Postgres
- Stripe: Scaling your API with rate limiters
- Martin Fowler: ParallelChange (expand and contract)
- GoCardless: Zero-downtime Postgres migrations, the hard parts
- Segment: Centrifuge, or how to reliably deliver billions of events