⏮️ Previous chapter: Case #1: The more senior the developer, the worse her incident stats
After an uncommonly bad week/sprint… what is the best way to ensure the next week/sprint won’t be this bad? Let’s have a retro. Or possibly: go yell at your developers, that also works amazingly.
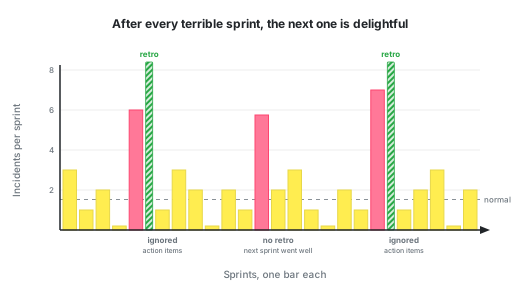
These sound like very arbitrary statements, but I am very confident that if you just had an extraordinarily terrible sprint, where lots of things went wrong (the migration locked up the database or the payment system was disabled for 30 minutes), you really can call a retro and things will go much better during your next sprint. And the best part is you don’t even have to do the action items you will agree on doing.
The next sprint will be better, just by the power of statistics. Your sprint’s success will regress to the average success value… most probably. Outliers are outliers because they are rare. It is most often bad luck that causes them.
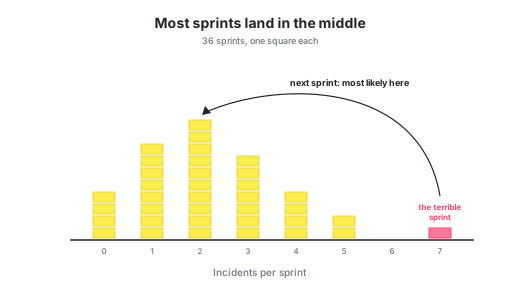
If this sprint was far from your average sprint, then chances are high your next sprint will be closer to your average sprint. You don’t have to do anything differently.
Who caused the bad week/sprint?
Whose fault is it?
If we can find the exact chain of events, then we can find the culprit, and then we can set up preventative measures to make sure the thing never happens again.
In the modern world, we severely ignore the power of luck. But it is competence PLUS luck that makes a success possible.
We like stories about people who have single-handedly overcome such incredible odds that luck could have absolutely no hand in their success. And even if you were given a bad hand in life, with dedication and perseverance, you can still become a success story. We believe luck is a nice-to-have, not a fundamental part of success. But we are wrong.
Often times, a week/sprint doesn’t turn into a disaster only because the team is doing something wrong, but because of a series of unfortunate events outside the team’s control. Or in other words: because the team was unlucky.
Events out of the team’s control:
- a big customer onboards,
- a cloud provider has a bad day,
- a certificate expires,
- a dependency ships a broken minor version, …
Catch the right timing
The success of your week/sprint can be measured like this:
\[\text{sprint success} = \text{fragility of our system} + \text{luck of the week}\]Luck plays an active role.
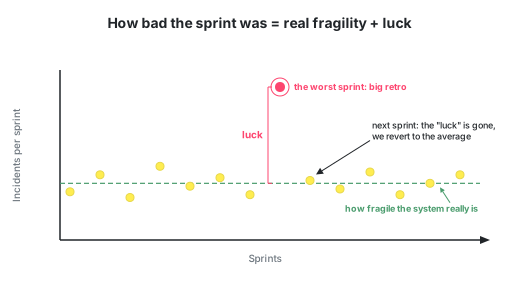
What changed between the terrible sprint and the good one? Not the team, nor the system. Not even the tickets are different. It is only the luck that changed.
Regression to the mean
Regression to the mean is the phenomenon where an extreme result is usually followed by a more ordinary one. It shows up whenever you have a noisy variable.
The reason for this is simple: outliers are rare, that is what makes them outliers, so the chance of getting two outliers in a row is small.
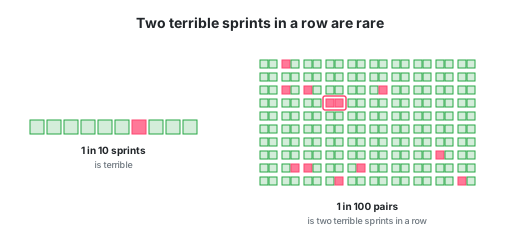
As people, we like cause and effect. We like to fix problems. And this is where we clash with this simple phenomenon.
As a reaction to a bad sprint, we want to change procedures, find a solution. Once the next sprint turns out better, we have proof that whatever we did is the thing that made the 2nd sprint good. In reality, however, it probably had no effect.
This is why having a retro but then not doing any of the action items might turn out to be just as effective as yelling at your team and just as effective as doing nothing at all.
But of course, doing nothing feels threatening, as if we are asking those same incidents to happen again, since we have built no new defense structures against them.
Scaling up the DB fixed it!
Thus, we like to do something, instead of just nothing. Even when that something has no basis in logic.
Let’s say the p99 latency jumps from 300ms to 4s. What can you do to get it to go down again?
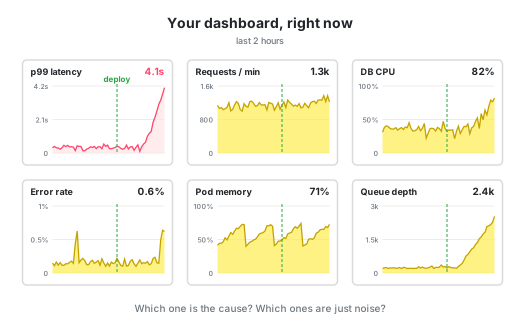
The charts might give you some ideas. A good backup plan is always to
- a) restart the pods,
- b) but maybe scaling up the database would also work,
- c) or adding more workers to the queue,
- d) or maybe rolling back the latest deploy, since we can see we just deployed something about 45 mins ago.
Let’s say you choose option (b).
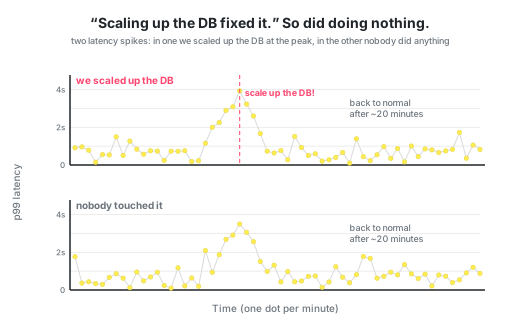
Then… some minutes later, the latency really does go back to normal.
Yeiii!! Problem solved.
Your report will say that scaling up the database solved the problem. Now, your arbitrary action has a high chance of becoming the standard solution for a latency spike.
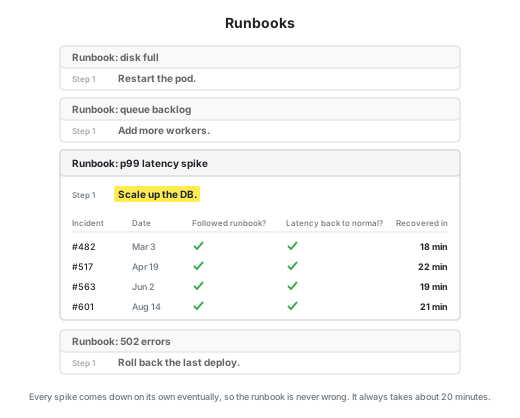
However, you have no proof that scaling up the database helped at all. Correlation is not causation.
In reality, latency spikes usually come down on their own, because some job finishes its work. Maybe a big import ends, or a large calculation finishes, or a problematic user logs off.
The thing is, we acted at the worst moment, so almost anything we did would have looked as if it worked.
The call for judgment
We need good judgment, the thing LLMs can’t do in our stead.
Of course, we should try to do something when latency spikes beyond what we consider acceptable.
But already step 1 needs judgment: “where is the acceptable boundary?”. We don’t need to act on every spike. Some spiking is expected.
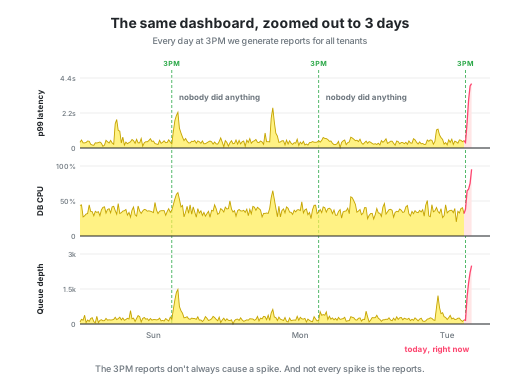
Sometimes a step back, a zoom out shows the bigger picture. Maybe the real culprit is something silly like: at 3PM every day we generate reports for all tenants of our app. Triggering 1000 background tasks at the same second does have the tendency to provoke a latency spike, a DB CPU spike and to fill up the queue.
# every day at 15:00:
for tenant in all_tenants:                # ~1000 tenants
    queue.push(generate_report, tenant)   # all in the same second
And nobody actually did anything during the last 10 3PM-spikes and still the latency figured itself out.
We also need judgment when broadcasting our solution.
If you had spun your chair 3 times and clapped twice, the latency might have also gone down. But most probably, you wouldn’t want this random act “spin in your chair 3 times and clap twice” to become the ritual by which your team solves latency from now on.
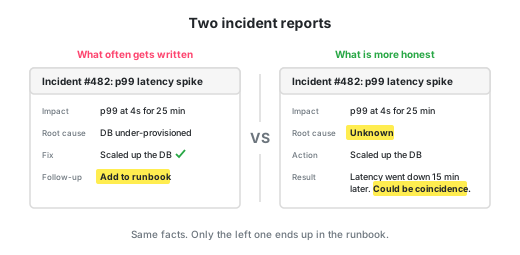
The trick is mostly in observing your system and your actions humbly. Maybe you have fixed the system, or maybe it wasn’t you.
A cheeky abuse of regression to the mean
The scenario I painted does offer one interesting opportunity, if we flip the pattern upside down.
If we know the metric will regress to the mean soon by itself, then we can use this fact to manufacture a new ritual.
Whatever we do before the latency goes back down will have data proving it works.
So… we might want to introduce reasonable things like:
- banning deploys on Fridays
- upgrading an old library
- ordering the nicer coffee machine for the office
- starting walking meetings
If we schedule the right events at the right time, we can make it look like these events caused the latency to go back down.
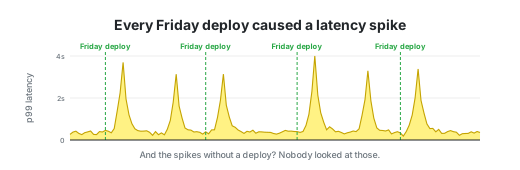
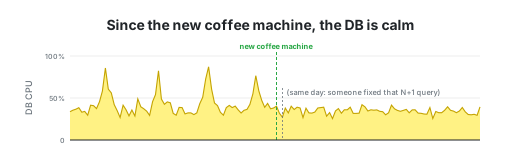
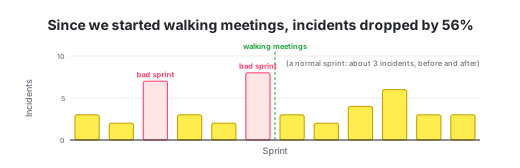
In economics this pattern has been researched a lot already. Below I describe one such study:
Rabbit hole: Does firing the manager help?
How does firing a manager affect her team?
In 2001, two Dutch economists, Allard Bruinshoofd and Bas ter Weel, looked at football and how changing the manager affects the team.
They looked at 12 seasons of the top Dutch football league and saw that just before a manager gets fired, the team’s results drop and once the new manager arrives, the results improve.
We could take this as proof that replacing the manager works wonders for the teams.
But then they also looked at teams with similarly bad runs that kept their manager. The results of those teams also improved. On top of that, they recovered faster than the teams that fired the manager.
We conclude from this that sacking a manager seems to be neither effective nor efficient in terms of improving team performance.
We document that performance improves following both forced and voluntary resignations. However, after close inspection, we find that this effect is likely not to be caused by the resignation as our control group exhibits even stronger performance increases. These results are consistent with those obtained in the econometric evaluation of social programs and labour market training programs (e.g. Heckman and Smith, 1999).
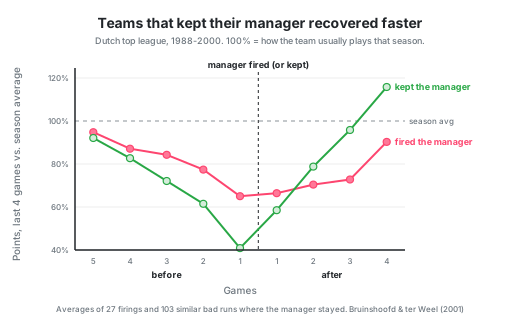
Both types of teams recovered. The teams that didn’t fire their manager recovered faster and to better results than the teams that did. The bad results were partly bad luck, but the new manager got the credit for the luck coming back.
However, this does not mean that keeping the manager causes a bigger comeback. Believing this would be making the same mistake again. All we know from this chart is that doing nothing worked at least as well as firing the manager.
9 out of 10 graduates of our bootcamp find a job in 6 months
Have you ever seen an ad saying something like: “9 out of 10 of our graduates find a job within 6 months!” Sounds great… until you ask how many people find a job within 6 months without the bootcamp.

- Who signs up for a bootcamp? Mostly people who just lost their job.
- When do they sign up? Right at their worst moment.
- What happens next? Most of these people eventually find a job, bootcamp or no bootcamp.
- And who gets the credit? The bootcamp. “9 out of 10 of our graduates find a job within 6 months!”
In the 70s, economists named this dip in the income of people who apply for a training program Ashenfelter’s dip (after Orley Ashenfelter, 1978). Here is a chart from a 1999 study of men who applied for a US job-training program, but were randomly kept out of it:
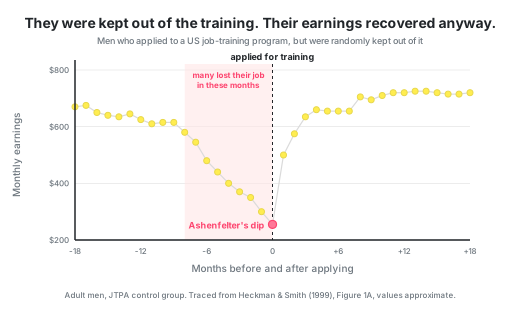
If the rejected group had been a bootcamp, their ad would say: “Our graduates’ earnings went up 180%!” (Measured from the worst month of their lives, of course.) It would have been technically true, mathematically true, but the implication would be a lie, because the implication is that “our training” made this happen.
People’s earnings simply regressed back to what they used to be before they lost their jobs (plus a small raise).
Rabbit hole: 1999 study of people who applied to a US job-training program
The football paper (in the football rabbit hole above) has a curious line: “These results are consistent with those obtained in … Heckman and Smith, 1999”. So, then… this is a known pattern?
Yes! In 1978, the economist Orley Ashenfelter looked at people who joined a government job-training program in the US, and noticed that their earnings dropped just before they joined.
Ok, but… why would that be a problem? Of course their earnings dropped just before “going back to school”, that is why they are “back to school”. If they had a successful career with lots of growth opportunities, they would hardly join a government job-training program. So obvious! (Heckman and Smith saw this too: men who had just lost their job were 10 times more likely to sign up than men who hadn’t.)
The dip becomes a problem once someone does statistics on top of it. Governments believed the training programs worked, because the earnings of the trainees went way up after the training.
Historically, evaluators of early U.S. job training programs used before-after comparisons of participant earnings. The problem with this approach is that it attributes all improvements in outcomes relative to pre-program levels to the program being evaluated.
Whether the pre-program drop in earnings is permanent or transitory determines what would have happened to participants had they not participated.
Interviews….. and picking the best candidate
The success of a job interview is of course also due to luck:
interview score = real skill + how the day went
Your performance in an interview is noisy already because the amount of knowledge you’d need is incredibly vast, but they can only ask a very small number of questions. We don’t even have to talk about whether the questions are relevant to the job or whether the exam-format spikes stress levels and makes it hard for you to show your skills.
But let’s talk numbers ;-).
interviewing.io is a platform where developers do anonymous technical interviews. After each interview, the interviewer rates the candidate’s technical ability from 1 (“meh”) to 4 (“amazing!”). This means they are able to publish very interesting charts.
In 2016, Aline Lerner looked at 299 interviews from 67 people who had interviewed at least twice. What she found was:
- “Many people who scored at least one 4 also scored at least one 2.”
- Even the strong ones, with an average of 3.3 or more, still showed “a fair amount of variation”. And for the average performers, between 2.6 and 3.3, “things get really murky”.
- A candidate with an average around 3, so someone who normally passes, “can mess up technical interviews as much as 22% of the time.” (That’s the upper end of their estimate, so “up to 22%”.)
Only about 1 in 4 developers performs consistently from one interview to the next. A single interview is a real measurement, but a very noisy one.
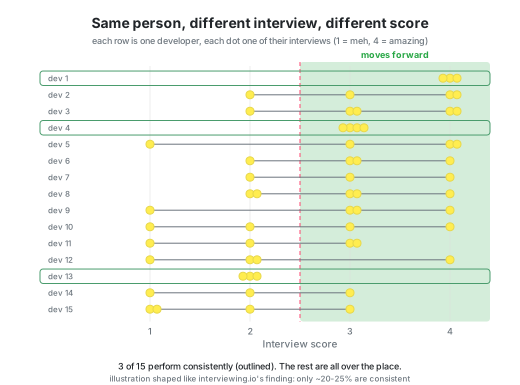
How much you jump around has nothing to do with how good you are. The relationship between someone’s average score and how volatile they were was practically zero (\(R^2 = 0.03\), R² measures how much one thing explains another, from 0 to 1. 0.03 means almost nothing). “people are all over the place regardless of how strong they are on average.”
\[\text{who jumps around more} = \underbrace{3\%}_{\text{their average score}} + \underbrace{97\%}_{\text{something else}}\]In other words: knowing how good someone is tells you almost nothing about how steady they’ll be.
Interview stats on a bigger scale
Eight months later, they repeated the analysis on more than a thousand interviews.
The new stats paint an even worse picture:
- “roughly 20% of interviewees are consistent in their performance (down from 25% the last time we did this analysis)”
- about 12% of people were extremely volatile: their scores had a standard deviation of a full point or more, on a 4-point scale
- the volatile people weren’t one specific type: about half worked at top companies and half didn’t
Thus, if we interview 20 people and hire the one with the highest score, who did we pick?
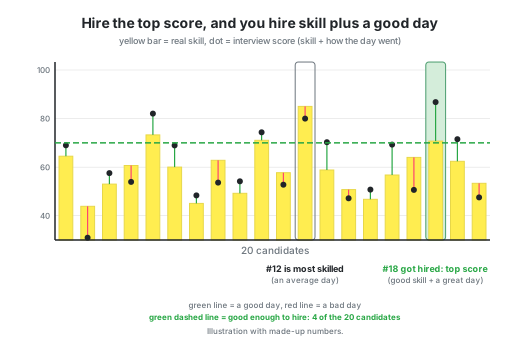
In this imaginary case, candidate #12 has the best skills (85), but she had an average day, which brought her score down to 80. However, candidate #18’s true skill is only 71, but she had a great day and her overall score is 86, the best of all the candidates.
So, we hired somebody with good enough skills on a good day. Once they start working for us, however, they will bring their skills with them, but they can’t bring the luck.
The optimizer’s curse
In decision science this has its own name: the optimizer’s curse.
Smith and Winkler described it in 2006: if you estimate the value of several options, and your estimates are noisy but completely fair, and you pick the option with the highest estimate… then the option you picked will, on average, disappoint you.
The act of picking the maximum creates the disappointment. You expect too much, because you picked “real value + luck”, but the luck will go away, and you will be left with only the “real value”.
Performance management and Bossware
It’s all fun and games until somebody gets hurt. With our quick and easy statistical analysis of whatever metrics we have, we often encode these mistakes into tools that decide somebody’s bonus, promotion or job security.
Our tool that ranks people’s performance could be:
- Measuring from the dip. The tool compares a team’s numbers before and after a new manager joined. The team’s numbers improved and the new manager gets a promotion, even though the manager did not cause the change.
- Ranking by one noisy number. The bottom 10% by this quarter’s closed tickets get a performance plan. Next quarter, most of them “improve”, not because of our actions, but because of luck.
- Making the best week the target. You closed 14 tickets in your best week, so now 14 is your target. Every normal week after that is “below target”.
- Picking the maximum. The tool ranks 200 candidates by a coding test and invites only the top 5 back. It invites the ones that happened to be the most lucky+good on that random day.
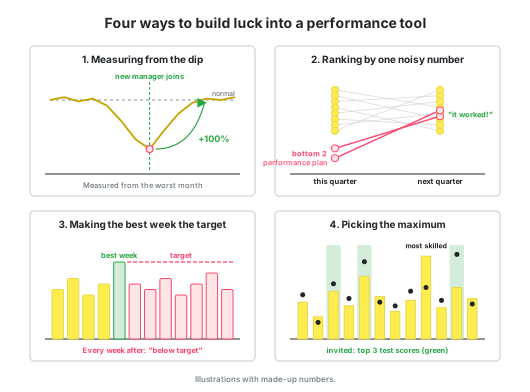
In each case, the code is technically correct, it just treats skill + luck as if it were all skill.
What can we do?
Look for a control group.
Before you credit some action for the good result, try to find a control group: an incident with the same properties where we didn’t execute this action.
The difference between what happened then and what happened this time is the impact of your “fix”.
Take more measurements.
One noisy sample is real signal + luck. Several samples averaged together cancel out much of the luck.
Google found (in Laszlo Bock’s book Work Rules!) that 4 interviews were enough to predict the hiring decision with 86% confidence, and each extra interviewer after the 4th added only about 1%.
Expect the extreme to move toward the middle.
If you react to the worst (or best) moment, expect the next moment to be closer to normal anyway. The improvement you see next time is not all yours, and the disappointment is not all theirs.
Be suspicious of any decision based on one extreme number.
Especially when that decision is permanent.
An extreme result is part real, part luck. If we act on it as if it was all real, the luck will make us look smart, or make someone else look bad.
Next chapter
⏭️ To be continued...
External sources
- Aline Lerner, interviewing.io: Technical interview performance is kind of arbitrary. Here's the data.
- Aline Lerner, interviewing.io: After a lot more data, technical interview performance really is kind of arbitrary
- Bruinshoofd & ter Weel (2001): Manager to go? Performance dips reconsidered with evidence from Dutch football
- Heckman & Smith (1999): The Pre-Program Earnings Dip and the Determinants of Participation in a Social Program
- Smith & Winkler (2006): The Optimizer's Curse: Skepticism and Postdecision Surprise in Decision Analysis
- Wharton: Open-sourcing Google's HR secrets (Laszlo Bock, Work Rules!)